
Appearance
Annotations
A note on the map can be two things, and the panel makes them one when it can:
- A map note. kepler's own annotation: a callout on the map with a text, a point, an arrow, a circle or a ruler. It belongs to the map.
- A Grafana annotation. A note in time, with a text and tags, that every time chart of the dashboard draws as a line or a band. It belongs to the dashboard.
A Grafana annotation that carries a place is drawn on the map as a map note, and a map note made on a dashboard can be saved as a Grafana annotation. The time charts then mark it in time and the map shows it in place.
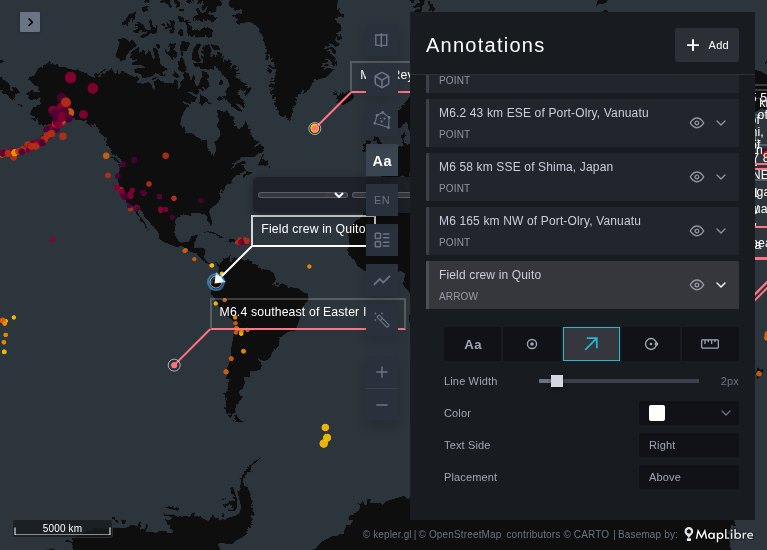
Map notes
Right-click an empty spot of the map → Add Annotation. A callout appears at the point with its text editor open; type, then click the bare map or press Escape to put it down. A right-click on a feature with a tooltip pins the tooltip instead; look for empty map.
The Aa button in the map's toolbar opens the annotation list. Every note is listed there, with:
| In the list | What it does |
|---|---|
| the eye | hides or shows the note |
| the kind | text, point, arrow, circle or ruler |
| line width and colour | the callout's line |
| text side and placement | where the text sits around the point |
| duplicate and delete | copies the note, or removes it |
With Aa on, a note can also be picked on the map and its text edited in place (double-click it).
A map note that is not a Grafana annotation is saved with the map configuration, like a layer.
Grafana annotations on the map
The Grafana annotations option, under Map, has three settings:
| Setting | What it does |
|---|---|
| Off | the map ignores the dashboard's annotations |
| Show (default) | annotations with a place are drawn as map notes |
| Show and save | also turns a note made on the map into a Grafana annotation, and writes edits and deletes back to it |
Where the place comes from
An annotation is drawn when it has a place, read from, in order:
- a callout saved in the annotation's
data(what the map writes when it saves a note), which keeps its kind, arm, angle and style; - a tag
geo:<lng>,<lat>, longitude first, as in GeoJSON —geo:-78.4678,-0.1807is Quito; longitudeandlatitudefields, when the annotation's source keeps them.
The tag is what makes an annotation placeable from any source: the built-in store, the HTTP API, or an annotation query. The comma between the two numbers may also be a space or a semicolon, which helps when a query returns its tags as one text that Grafana splits on commas.
An annotation without a place stays on the time charts and is left off the map.
When it shows
A note is shown while its time overlaps the map's window: the map's time filter when it has one (the slider, the Time Brush), the dashboard's time range otherwise. A range annotation shows for as long as its range touches the window.
An annotation query with places
Any data source that offers annotations can produce them. With Infinity, for instance, the strong earthquakes of the week from the USGS feed, each tagged with its epicentre:
Parser:        Backend
URL:           https://earthquake.usgs.gov/earthquakes/feed/v1.0/summary/2.5_week.geojson
Root selector: features[properties.mag >= 5.5].{
                 "time": properties.time,
                 "text": "M" & $string(properties.mag) & " " & properties.place,
                 "tags": "quake,geo:" & $string(geometry.coordinates[0]) & " " & $string(geometry.coordinates[1])
               }
Columns:       time (Timestamp epoch), text (String), tags (String)
The space inside the geo: tag is deliberate: Grafana splits a text column of tags on commas, so quake,geo:165.8 -14.1 arrives as the two tags quake and geo:165.8 -14.1.
Saving map notes as Grafana annotations
With Show and save, a note made with Add Annotation becomes a Grafana annotation as soon as it is put down. It is saved with:
| Field | Value |
|---|---|
| time | the map's window: its time filter, or else the dashboard's time range |
| text | the note's text |
| tags | map, and geo:<lng>,<lat> for its place |
| data | the callout itself, so it comes back with the same kind and style |
| panel | none: the note belongs to the dashboard, so every time chart draws it |
The map shows the note at once. The time charts draw the new band at their next refresh: press the dashboard's Refresh button, or wait for its auto-refresh. The panel does not refresh the dashboard itself: Grafana offers a panel no way to re-run the dashboard's annotations short of its own annotation editor, which ties an annotation to one panel. The same goes for an edit or a deletion made on the map.
From then on the note is the annotation. Editing its text, moving it, or changing its kind or style in the list writes the change to Grafana when the note is put down. Deleting it in the list deletes the annotation. An annotation from an annotation query cannot be changed from the map — it is the query's — and deleting one only hides it until the page is reloaded.
Notes that are Grafana annotations are not saved in the map configuration: they come back from Grafana with the dashboard, and a copy in the dashboard JSON would show twice.
Who can write
Saving, editing and deleting need the viewer's own permissions on annotations (annotations:create, annotations:write, annotations:delete), as on Grafana's own panels. A viewer without them — an anonymous visitor on a public instance, typically — sees the annotations, and can still add map notes for themselves, which go away on reload.
Where Grafana keeps annotations
In its own database (grafana.db by default, or the MySQL or PostgreSQL Grafana is configured with), not in the dashboard JSON. They are tied to the dashboard by its UID, so they survive the dashboard being saved or provisioned again — and they do not travel with it: a dashboard copied to another Grafana, or synced from Git, arrives without them.
Grafana has no page that lists every annotation. To see and manage them:
- on a time series panel, hover an annotation's marker to see it, edit it or delete it;
- an Annotations list panel lists them, filtered by dashboard, time range and tags —
mapfor the notes made on the map; - Dashboard settings → Annotations manages where annotations come from, not the annotations themselves.
Written against kepler.gl 3.3.0-alpha.20. See Differences from kepler.gl for what changes inside a Grafana panel.