
Appearance
Velocity fields
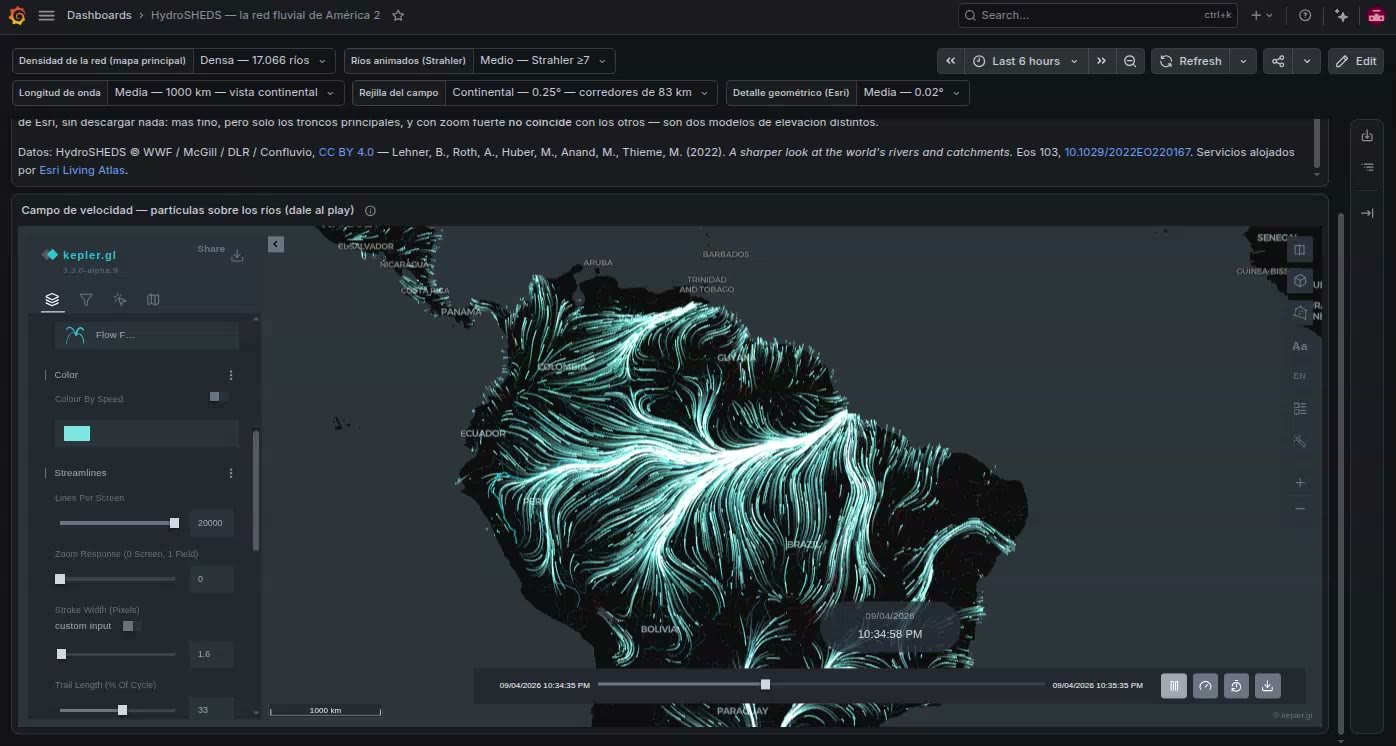
Three layer types draw a field of velocities — wind, currents, any flow given as a vector at each place. Two are this plugin's and are built from a query. The third is kepler's own, which the panel steps aside for when it has built its own.
flowfield
sql
SELECT ts AS "time", lat, lon, speed, direction
FROM wind_grid;
Named Streamlines in kepler's layer menu. Built automatically from a position and a velocity, with no trip id, when the rows lie on a regular lattice. Animated streamlines traced through the grid; the dashboard's clock chooses which hour of a forecast is drawn.
See Wind and other velocity fields.
vectorfield
Arrows or wind barbs over the same grid, one mark per sample. Never guessed: switch a Streamlines layer's type, or add it from Add Layer. See Arrows and wind barbs.
flowField
sql
SELECT lat, lon, u, v
FROM station_winds;
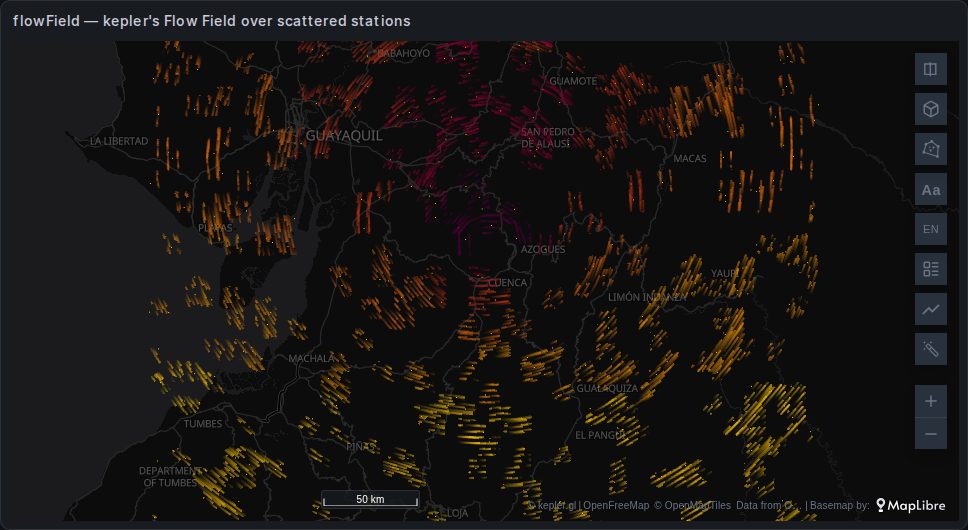
kepler's own streamlines layer, Flow Field in the layer menu, new in kepler 3.3. Like Streamlines it draws animated trails through a field; unlike it, it builds the field from whatever rows it is given, scattered or not. The image shows 400 scattered rows.
When you get it
kepler creates it by itself for columns named exactly u and v beside a position. What the panel does with it depends on the rows:
| The rows are | What the map gets |
|---|---|
| A regular lattice, no trip id | The panel's Streamlines. kepler's Flow Field and Point layer are removed. |
Scattered — stations, buoys — with u and v | kepler's Flow Field and a Point layer. The panel builds no Streamlines. |
| Scattered, with speed and direction or other names | Points only. Add the Flow Field by hand. |
Removing it over a lattice is deliberate: the two layers would draw two sets of lines over one grid, the second on a clock of its own. It stays in Add Layer for anyone who wants it.
To add it by hand, choose Add Layer → Flow Field, then a column mode and the columns.
What it needs
A position, as Lat / Lng or as a GeoJSON column (each feature's centroid), and one of three column modes:
| Column mode | Required | Optional |
|---|---|---|
| U / V components | u (eastward), v (northward) | altitude |
| Speed / direction | speed, direction — the bearing it comes from | altitude |
| Altitude (downhill) | altitude, a value whose downhill slope is the flow | — |
The optional altitude lifts the lines in 3D, scaled by Elevation Multiplier.
How it builds the field
Rows that already lie on a regular spacing are used as the grid itself, as long as neither side has more cells than Grid Resolution. Any other rows are dropped into a grid of that many cells along the longer side, and the cells holding several rows take their average. Smoothing then blurs the field over that many neighbouring cells, which also fills empty ones; at 0 the raw samples are used and empty cells stay empty.
So between stations what you see is the blur, not a measurement. The Debug Grid switch draws the grid and marks the cells that hold data.
Settings
| Setting | Default | What it does |
|---|---|---|
| Lines Per Screen | 7500 | How many streamlines to aim for in the current view |
| Zoom Response | 0.25 | 0 keeps the line count as you zoom; 1 keeps their spacing on the ground |
| Stroke Width | 3 | Line width in pixels |
| Color By Speed | off | Colour by speed with the palette, or one colour |
| Opacity | 0.55 | |
| Trail Length | 22 | Visible trail, as a percent of the cycle |
| Cycle | 20 | Seconds for one loop of the animation |
| Line Lifetime | 0.55 | How long a trail stays, as a fraction of the cycle |
| Seamless Loop | on | Repeats the trails so they do not pop off at the end of the cycle |
| Smoothing | 4 | Blur radius, in grid cells |
| Grid Resolution | 64 | Grid cells along the longer side of the field |
| Elevation Multiplier | 1 | Scales the altitude column's height |
| Debug Grid | off | Draws the grid |
Next to Streamlines
Streamlines (flowfield) | Flow Field (flowField) | |
|---|---|---|
| Rows | a regular lattice; anything else draws nothing | anything; binned, averaged and smoothed |
| Built from | speed and direction, or u and v, under several names | u and v exactly; other modes by hand |
| Hours of a forecast | the map's time filter picks the latest hour in its window | no time input: every row it receives goes into one grid |
| Direction | where it comes from or where it goes, set on the layer | where it comes from |
| From a single value | downhill, uphill or along the contours | downhill |
| Position | latitude and longitude | latitude and longitude, or a GeoJSON column |
| Arrows instead of lines | switch to vectorfield | — |
Use Streamlines for gridded model output — forecasts, reanalyses, ocean models — and whenever the query carries several hours. Use kepler's Flow Field for observations that are not on a grid, and read it as an interpolation.
Backed by deck.gl's TripsLayer, which kepler animates on a loop of its own.