
Appearance
Data links and actions
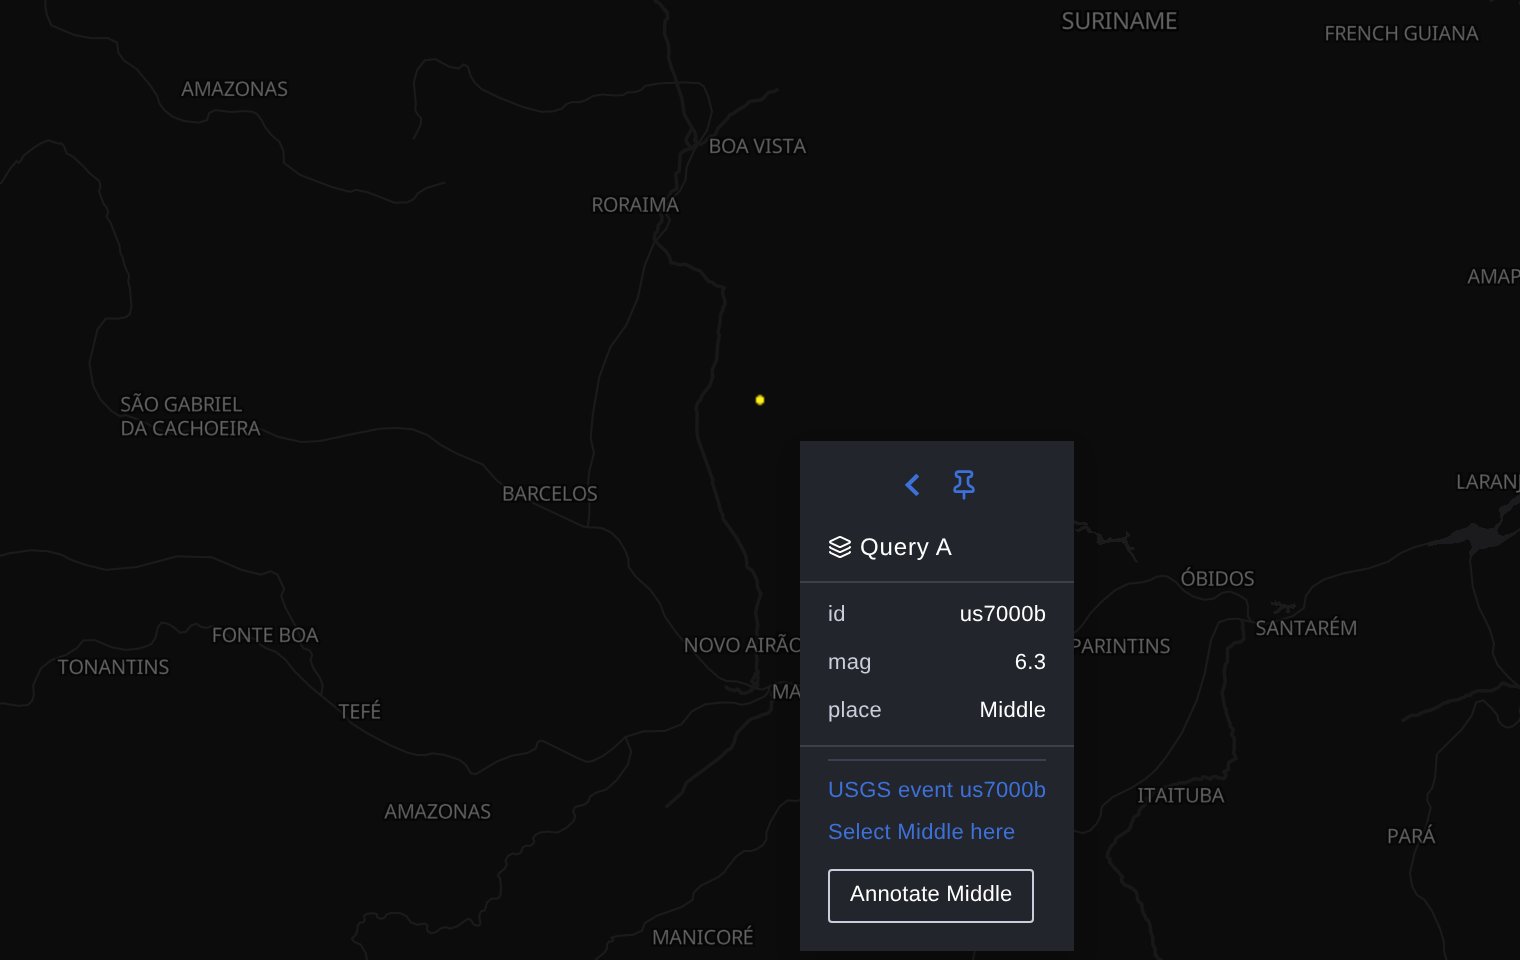
A click on the map can take the reader somewhere else, or do something, the way a click on a table row does. Grafana's own data links and actions work on the map: you configure them where you would on any other panel, and they show in the popup of the entity the reader clicks.
| What | What the click does | Who sees it |
|---|---|---|
| Data link | opens a URL built from the clicked row: a dashboard, a page, a tool | everyone who can see the dashboard |
| Action | sends an HTTP request built from the clicked row, after a prompt | only people who can edit the dashboard |
The same popup can also add the clicked value to the dashboard's ad hoc filters, as a table cell does.
Where to configure them
In the panel editor, Data links and actions sits near the end of the options, with Add link and Add action. These are Grafana's own editors; the map adds nothing to them. A link or an action set there applies to every query of the panel. To give one query, or one column, its own links, use Add field override with a matcher such as Fields returned by query.
The rest of Grafana's field options (unit, colour scheme, thresholds, value mappings) are not offered: the map colours its layers itself, and they would do nothing.
Data links
A link's URL is a template over the clicked row. Everything Grafana's links understand works:
| Template | What it gives |
|---|---|
${__data.fields.id} | the clicked row's value of the id column |
${__value.raw} | the value of the field the link is set on |
${__url_time_range} | the dashboard's time range, as from=…&to=… |
${region}, ${region:queryparam} | a dashboard variable |
A link to the earthquake's page at the USGS, and one that re-opens this dashboard on the clicked earthquake:
Title: USGS event ${__data.fields.id}
URL:   https://earthquake.usgs.gov/earthquakes/eventpage/${__data.fields.id}
       Open in new tab: on

Title: Show ${__data.fields.place}
URL:   /d/earthquakes?var-quake=${__data.fields.id}&${__url_time_range}
The values come from the row the reader clicked, also on a layer whose rows are not the query's one by one: a trip layer groups the query's rows into one path per id, and a click on the path fills the link from that trip. A column a field mapping renamed for kepler (a lat the map reads as its latitude) is still found under its query name.
A link set on every field, as the defaults are, shows once, not once per column.
In the popup
The links show in the popup kepler opens on a click, under the entity's fields. The tooltip that follows the pointer shows none: it moves away before it can be clicked.
A plain click follows the link: inside Grafana it moves to the page without reloading it, outside it opens the URL (in a new tab when the link says so). Ctrl+click or a middle click open it in a new tab, as on any link.
One click
Turn on One click in a link and a click on the entity follows it at once, with no popup in between. One rule decides when, because the map's click can already mean something else:
- When the click selects — a Click mapping resolves on the entity, or Click to set the area puts the drawn area around it — it selects, and the link waits in the popup.
- When it selects nothing, the one-click link is followed.
So turning a link to one click never takes a selection away from a map that had one.
Actions
An action is a button that sends a request: dispatch a unit to an address, close a citizen report, open a ticket, write a note. Its URL, body, headers and query parameters are templates over the clicked row, exactly like a link's.
Title:   Close report ${__data.fields.id}
Method:  POST
URL:     https://ops.example.org/reports/${__data.fields.id}/close
Body:    {"by": "${__user.login}"}
The map builds and sends them as Grafana's own panels do:
- Every action asks first. A dialog shows the action's Confirmation text, or Are you sure you want to …? when it has none, and nothing is sent until the reader confirms.
- An action can ask for values. Declare variables on the action (a note, a priority) and the reader fills them in before the confirmation;
$notein the URL, body or confirmation is replaced by what they typed. - Only people who can edit the dashboard see actions. That is Grafana's rule, and the map keeps it: a viewer, and an anonymous visitor of a public dashboard, see the links and no action button.
- The request leaves from the reader's browser, through Grafana's request service, with Grafana's API call was successful or error notice afterwards. Never put a key or a password in an action: anyone who can edit the dashboard can read it.
- One click works as for links: an action marked one click opens its dialog on the click when the click selects nothing. A one-click link wins over a one-click action.
Actions on this Grafana
An action may call Grafana's own API, for instance to put an annotation on the dashboard from the place the reader clicked:
Title:        Annotate ${__data.fields.place}
Method:       POST
URL:          /api/annotations
Body:         {"dashboardUID": "${__dashboard.uid}",
               "text": "${__data.fields.id} at ${__data.fields.place}: $note",
               "tags": ["map"]}
Headers:      Content-Type: application/json
Variables:    note (Note)
Confirmation: Add a note on ${__data.fields.id}: "$note"?
Grafana refuses a POST or PUT from an action to its own address unless the path is allowed in [security] actions_allow_post_url (GF_SECURITY_ACTIONS_ALLOW_POST_URL=/api/annotations here). Requests to other sites are not limited by it.
Ad hoc filters
Grafana's table adds a cell's value to the dashboard's ad hoc filters: Filter for value adds column = value, Filter out value adds column != value, and every query of that data source on the dashboard is filtered by it. The map does the same from the popup of a clicked entity.
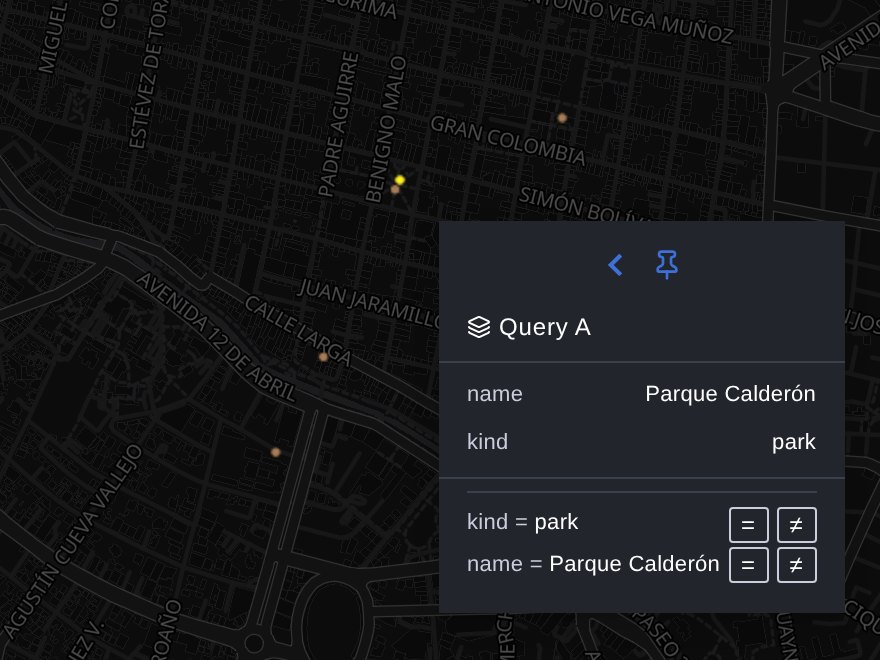
Pick the columns under Cross-filtering → Ad hoc filters from the popup. The popup of a clicked entity then lists each one with its value and two buttons, = (filter for) and ≠ (filter out). The filter lands in the dashboard's filter bar, where it is removed like any other, and the popup closes while the queries run again. A button is greyed out when the dashboard already applies that filter; the other one swaps it.
The buttons show only when the dashboard has an ad hoc filters variable for the panel's data source (Settings → Variables → New variable → Ad hoc filters, with the same data source as the panel). Without one they stay hidden: the map does not create a variable, as the table does, for a data source that might ignore it. A panel on the Mixed data source shows none either.
The data source decides what a filter does, and not every one applies ad hoc filters:
| Data source | Applies ad hoc filters |
|---|---|
| Chaski (DuckDB in the browser) | yes: each panel's result is filtered on the columns it has; a panel without that column is left as it is |
| DuckDB (MotherDuck plugin, the server) | no: the filter shows in the bar and changes no query; use a click mapping instead |
| Infinity | no |
| Prometheus, Loki, Elasticsearch | yes, each in its own way (labels, fields); for another, see its documentation |
The key is the query's column name, also for a column kepler reads under another name, and the value is the clicked value as text, as the table writes it. A column with no value on the entity, or a geometry, offers no filter.
What has no links
- Aggregated layers (hexbin, grid, cluster): a cell is many rows, not one, so there is no row to fill a link from.
- WMS and raster layers: the values of a clicked pixel come from the image service, not from a query's rows.
- A layer with its tooltip off: kepler resolves no row for a click on it, so it opens no popup and has neither links, actions nor ad hoc filters, one-click ones included.
- Actions sent through the Infinity data source (newer Grafana versions, credentials kept on the server) are not offered on the map; only the plain HTTP kind is.
See Cross-filtering for what else a click can publish, and Select from the popup for a popup that asks before it selects.