Appearance
Symbols
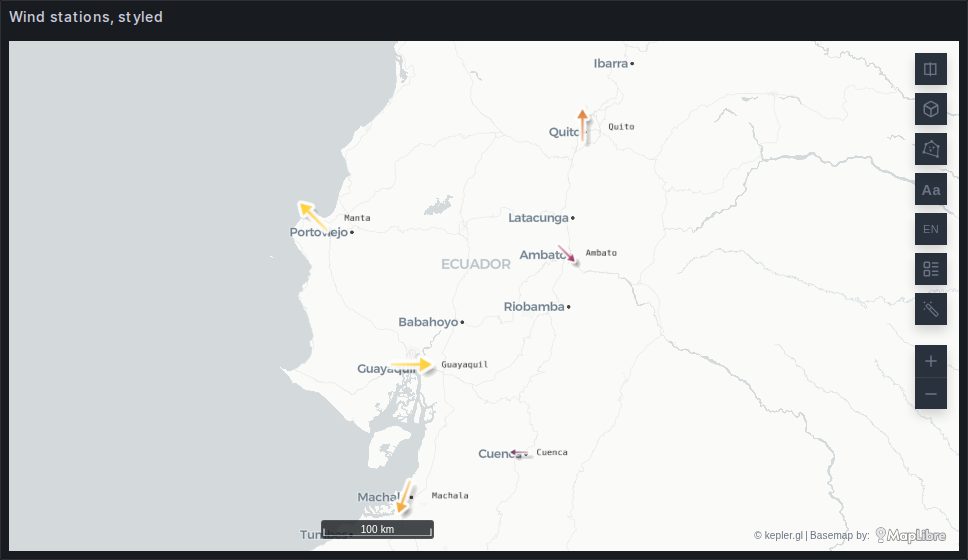
One mark per row, turned to a bearing the query carries. A fleet of buses pointing where they are heading, a set of vessels on their course, a network of weather stations each showing its wind — the things a plain dot cannot say.
The minimum
A position and a numeric bearing:
sql
SELECT station        AS name,
       lat            AS latitude,
       lon            AS longitude,
       wind_speed,
       wind_direction
FROM observations;
That is enough. The panel builds a Symbols layer, turns each arrow to wind_direction, and removes the Point layer kepler would otherwise have guessed from the same coordinates — the dots would be the same eight places, saying nothing about the bearing, sitting underneath.
The bearing has to be a number
Detection goes by name, and track, course, heading or direction are as likely to name a label or a URL as they are a number of degrees. A bearing column whose values are not numeric is set aside rather than used, because a symbol layer built on one is worse than none: kepler drops a rotation channel it cannot read, and the layer has already taken the place of the Point layer.
The column names that are recognised
| Role | Names | What it does |
|---|---|---|
| Rotation | bearing, heading, course, cog, track, azimuth, orientation | turns the symbol |
| Magnitude | magnitude, intensity, amplitude | sizes it |
A wind direction counts as a bearing too: wind_direction, winddirection, wind_direction_10m, direction, wind_dir, wd. The difference is which way it is read — see below.
Both roles are in the Field mapping editor, so a column called something else is pointed at the role by hand, per query.
magnitude no longer sizes a flow
A column literally named magnitude used to be read as a flow's count. It is now the symbol layer's size role, and it can only land in one of the two. If a flow query's weight column happens to be called that, map it to Count by hand under Field mapping.
Which way the bearing is read
Meteorology names a wind by where it comes from: a 90° wind is an easterly, blowing towards the west. Everything else — a vehicle, a vessel, an aircraft — names the direction it is going.
The layer reads a wind direction the meteorological way and anything else as a course, and either reading can be set explicitly on the layer under Direction is. It matters: a fleet drawn with the wrong convention points backwards, which looks like data that is subtly wrong rather than a setting that is plainly wrong.
Choosing a shape
The layer draws from a catalogue of more than a thousand shapes:
| Source | Count | Licence |
|---|---|---|
| The plugin's own | a few | — |
| Maki | 215 | CC0 |
| Temaki | 556 | CC0 |
| OCHA Humanitarian Icons | 272 | CC0 |
They are sorted into sixteen themes — transport, water, health, energy, hazards, and so on — and the picker opens on the theme the symbol in use belongs to, drawing every glyph beside its name. The plugin's own four (arrow, circle, square, triangle) are the ones that read as a direction rather than as a thing; the icon libraries are for saying what is there.
All three libraries ship inside the plugin as path data. Nothing is fetched at runtime, so the symbols draw on an air-gapped install and under a strict Content-Security-Policy.
Size, and the rest of the styling
Everything below is on the layer's own panel inside the map, not in the panel options.
| Setting | What it does |
|---|---|
| Size (px) | one size for every symbol |
| Size range (px) | when a column is bound to size, the range it is spread over |
| Angle (°), when no column | a fixed bearing, for a layer with nothing to turn by |
| Outline / colour / thickness | a contour, so a dark symbol survives a dark base map |
| Shadow / intensity / distance | a drop shadow, which does the same job differently |
| Lighten towards the tail | fades each symbol from its tip backwards, so a dense field reads as flow |
| Stand upright in 3D | the symbols face the camera in a tilted view instead of lying flat |
| Thin overlapping symbols | drops the marks that would overlap, at a minimum spacing you set in px |
Labels work the way they do on the point layer: pick a column under kepler's own Label section and every symbol is captioned with it.
Thinning is not filtering
Thin overlapping symbols drops marks that would collide at the current zoom and brings them back as you zoom in. The rows are all still there — for tooltips, filters and the rest of the dashboard. It is a drawing decision, not a data one.
A picture per row
Instead of a shape, the layer can draw an image. Set Draw to A picture and either give a Picture URL for the whole layer, or bind a picture column and let each row name its own — a logo per operator, a photograph per site, a flag per country.
- Pictures load through an ordinary
<img>rather than through loaders.gl, which is what lets them work under a strict Content-Security-Policy. - A small image can be uploaded into the layer instead of hosted, up to 75 KB. It is stored in the saved map configuration, so it travels with the dashboard.
- Anchor puts the image's centre on the row's position, or its bottom edge — the difference between a circular badge and a pin.
- Up to 96 distinct pictures are drawn per layer; beyond that, rows fall back to the layer picture.
When one fails, the layer panel says why rather than drawing nothing in silence: a blocked cross-origin fetch, an http picture on an https Grafana, a timeout, or a file that is not an image deck.gl can read.
Adding one by hand
Nothing stops a dataset without a bearing from being drawn as symbols — a fixed angle is a perfectly good setting. Add a layer in kepler's panel, choose Symbols, and point its lat and lng columns at the dataset. The panel's own layer types carry an amber icon in that list, so they are easy to find among kepler's.
When it is not symbols you want
- Rows are a grid of velocities, not scattered points → Velocity fields; a grid is drawn as streamlines or as a vector field, and only a scattered set of stations falls back to symbols
- You want reference points you can drag, not one mark per row → Markers
- The bearing is what you want to animate, not to draw → Trajectories
- You only need a dot → Points