Appearance
Cards on any layer
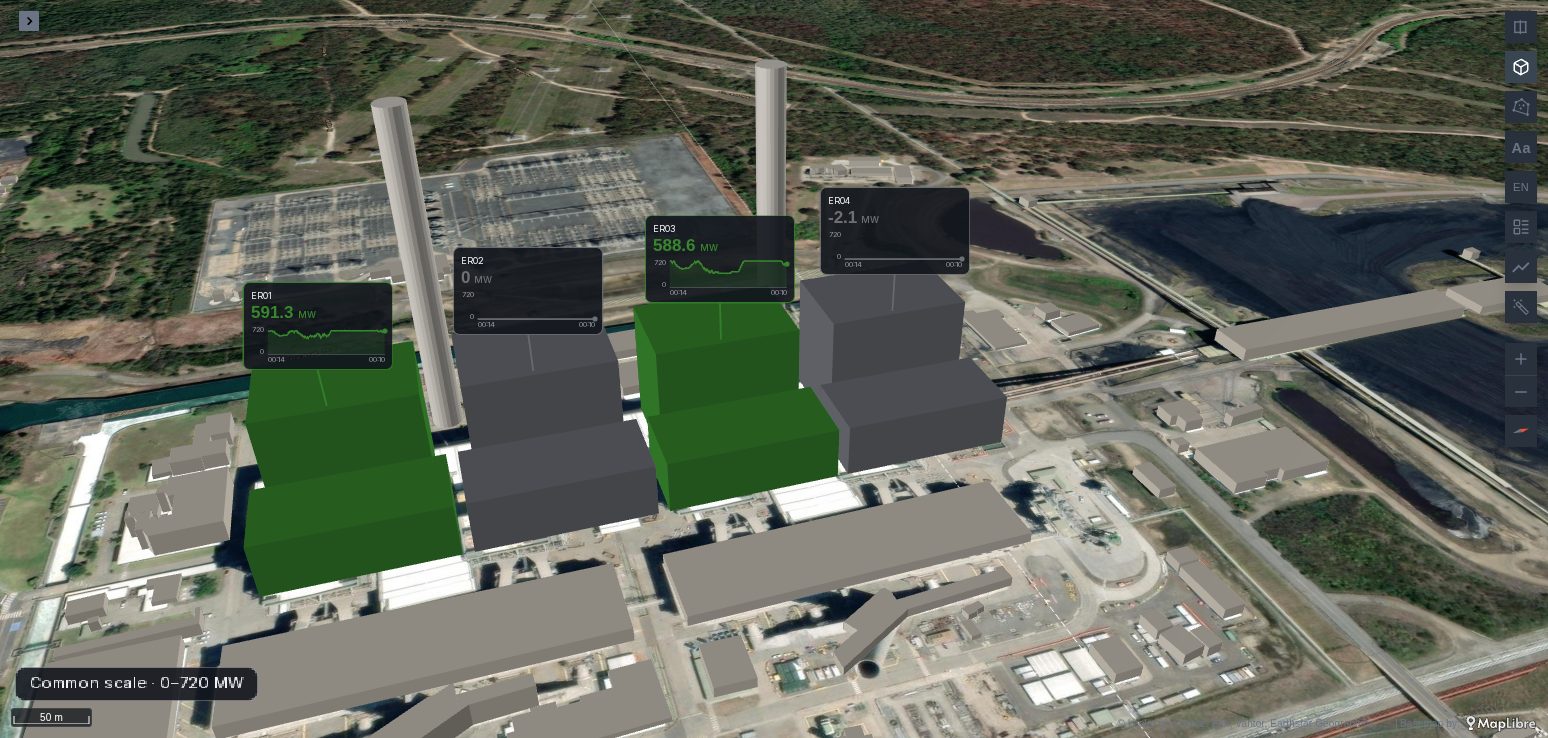
The 4D Model, Gauge, 3D Shape, Coverage, Traffic and Pipeline layers can show a card for each of their objects, with its name, its reading at the map's instant and its series over the dashboard's time range, in place of kepler's popup or all the time. One layer then gives each object its colour and its card, where a Sparkline layer beside it was needed before.
Since Plus 1.7.0
Cards on these layers are new in Plus 1.7.0, not released yet. Show is Tooltip by default, so a saved map keeps kepler's popup until you change it.
See it in the layer tour
The Digital twin map of the layer tour, installed with the app, shows a 4D Model in State mode with a card on each storey (Cards always) and a chilled-water riser whose card shows on hover, on the app's sample building, on synthetic data. Open it and press ▶ on its time filter to replay the day.
Turning them on
Each of these layers has a Cards group among its settings, next to Allow hover. Its Show setting picks how the layer tells you about an object:
- Tooltip, the default: kepler's popup on hover, with its History chart if the layer has one. No cards.
- Card on hover: hovering an object shows its card instead of kepler's popup. The card stays for a moment after the pointer leaves, so the pointer can reach it, and has a pin in its header: click it and the card stays on the map. Pins are saved with the map, so save the dashboard to keep them; click the pin again to drop it.
- Cards always: every object's card that fits on the map.
A click on an object still reaches the panel's click variables, whatever Show is. See Cross-filtering.
One card per object
The card belongs to the object the layer draws, the same one its popup's history follows:
| Layer | One card per | Where it stands | Placement by default |
|---|---|---|---|
| 4D Model | part the rows name | the top of the part, over the middle of its footprint | Above, on a stem |
| Gauge | place, or asset when there is one | the gauge's point | Beside |
| 3D Shape | place, or asset | the top of the shape when it is sized in metres; its base when in pixels | Beside |
| Coverage | sector: a site and its azimuth | the site | Beside |
| Traffic | link: its two ends | halfway between them | Beside |
| Pipeline | line | halfway along it, at its height there: a riser's card stands halfway up | Beside |
A 4D Model's cards appear once its model has loaded. Rows that kepler's filters hide take their object's card with them; the time filter does not, as it sets the instant instead (see below).
What a card shows
- Header: the Name; on a 4D Model, the part's id before it when the two differ. Name on Auto is the layer's label field, else the first text column.
- Value: the reading at the map's instant, in the object's colour on the map, followed by the Unit.
- More values: further numbers of the same object, one row each under the value, with a label on the left and the value and its unit on the right: a room's temperature and humidity under its CO2, a unit's voltage under its output. See More than one value.
- Chart: the object's readings along the Time column over the dashboard's time range, with a dot on the current reading. With Time at None (value only), the card is smaller and shows the value alone.
Value is the layer's colour field by default, when it holds numbers: a 4D Model coloured by its units' output shows that output. Pick another numeric column when the layer is coloured by a state or a category.
The instant is the cursor of a time filter on the Time column (on a 4D Model, on its Reading time), so kepler's playback and a Time Brush walk every card, and the chart dims after the cursor. Without a time filter, a card shows the object's newest reading. See Time playback.
With Scale at Common, every chart shares one vertical range, given by a note in the bottom-left corner of the map while the cards show all the time; Per card scales each chart to its own readings. Min and Max fix the range's ends.
An object whose readings stop goes into alert as a Sparkline card does: after three of its usual intervals without one, the card shows No data in red with how long it has been silent.
More than one value
Under More values, Add a value adds a row to every card of the layer: pick a numeric column, and write its label (the column's name when left empty) and its unit. Up to four rows; × removes one. The rows go under the value and above the chart, and every card of the layer grows by the same height, so the cards stay aligned.
A row shows the column on the row the card reads, at the map's instant. When that row has no value there, the row shows the object's newest value before it: a sensor that sends a reading only when it changes keeps showing its last one. An object with no value at all in that column shows a dash.
A Gauge of rooms coloured by CO2, with a temperature and a humidity column in the same query:
sql
SELECT room, latitude, longitude, co2_ppm, temp_c, rh_pct FROM ...Value co2_ppm with Unit ppm, and two rows under More values: temp_c, Temperature, °C, and rh_pct, Humidity, %. Hovering a gauge then shows the room, its CO2, and its temperature and humidity under it.
Since Plus 1.7.0
More values is new in Plus 1.7.0, not released yet.
Where the cards go
Placement puts each card:
- Beside its object: in one of the four corners around it, as a map places its labels, worst band first. A card that does not fit is left out until there is room, or until it is hovered.
- Above, on a stem: centred over the object at the end of a vertical stem, the way a 3D map labels a summit or a building's floors. Cards climb to a higher level to clear each other. This is how a 3D Callout places its cards.
At most 60 cards are placed at once, not counting pinned ones and those in alert. Cards are drawn above every layer, the map's labels included, and the cards of several layers on one map keep off each other: the layer higher in kepler's layer list places its cards first.
Grafana alerts on the cards
A card can show a Grafana alert about its object. Set Alert label to the label your alert rules name the object by, such as duid for a unit or site for a site, and turn on the panel's Active alerts with Entity label set to the same label. A firing alert whose label holds an object's value marks that object's card: placed first, drawn over the others, with a blinking button and the rule's name in red in its header.
The object's value is read from the layer's column named like the label, else from the object itself (a 4D Model's part, a Gauge's place). With Card on hover, a card with a firing alert shows without a hover, as a pinned one does, and goes when the alert stops; its pin stays off, and a click on it pins it for good. Only Grafana's alerts do this: a card in alert for no data still waits for a hover.
Entity label is what brings the alert onto the map: it places each alert on the row of the panel's data that holds the label's value. An alert Active alerts cannot place reaches no card. The alert is also drawn as a point at that row's coordinates, which on a 4D Model are the model's origin.
Options
In the layer's Cards group. Everything but Show appears once Show is not Tooltip.
| Option | What it does | Default |
|---|---|---|
| Show | Tooltip (kepler's popup), Card on hover (pinnable), or Cards always. | Tooltip |
| Placement | Beside the object, or Above, on a stem. | by layer, see above |
| Value | The number each card shows and charts: Colour field, or another numeric column. | Colour field |
| Time | The time column the series runs along; None (value only) shows the value alone. | Auto (first time field) |
| Name | The text column in the header. | Auto |
| Unit | Text after the value, kept as typed: a leading space sets it apart ( MW). | empty |
| More values | Up to four more numeric columns, a row each: column, label, unit. See above. | none |
| Alert label | A Grafana alert label naming the objects; see Grafana alerts on the cards. | empty |
| Size | Small, Medium or Large. | Small |
| Scale | Common to all cards, or Per card. | Common |
| Min, Max | The charts' vertical range. Empty: from the readings, the top rounded up. | auto |
The pins of Card on hover are saved with the map; there is no setting for them, only the pin on each card.
When there are no cards
- No card at all. Show is still Tooltip, or the layer is a kind without cards (Surface, Fleet and Sparkline have their own).
- Cards with no value. Value is the colour field and the layer is coloured by text, or by one colour. Pick a numeric column under Value.
- A column named
flowis not in the lists. The panel reads aflowcolumn as an origin–destination count and renames itcount; pickcount, or give the column another name in the query. - Cards with a value but no chart. Time is None, or the data has no time column.
- Only some cards. The others do not fit Beside their objects: zoom in, pick a smaller Size, or place them Above, on a stem.
- No alert on a card. The panel's Active alerts are off, its Entity label is not the card's Alert label, the alert is pending rather than firing, or its label's value is not the object's.
Use it for
- Digital twins: a 4D Model in State mode with each unit's colour and its output over the day from one query.
- A Gauge per site with its series, without a Sparkline layer on the same points.
- The flow on each link of a network, or in each pipe of a plant, where the line is.